
NUTRISI SIDHAT 1
Fish, eel, mixed species, raw
Serving size: 1 fillet (204 g)FOOD SUMMARY
 The Nutrition Facts label is generated according to the nutrition labeling standard maintained by the FDA. You will find Nutrition Facts labels in the same format on all packaged foods sold. The panel gives information about the nutrients that the FDA has determined are most critical in the American diet. Changing the serving size in the Serving Size drop-down at the top of the page will automatically update the Nutrition Facts panel with values for the selected serving size. |
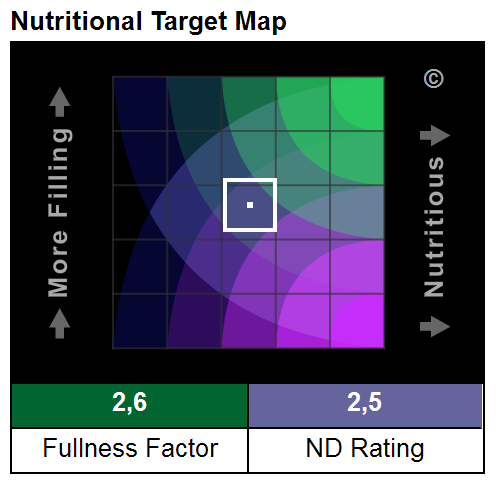 Nutritional Target Map™ (patent pending)This graphic helps you see at a glance how foods line up with your nutritional and weight-management goals by telling you how nutritious (nutrient-dense) and filling (calorie-dense) a food is. Foods are mapped according to two nutritional indices that were developed by Nutrition Data:
Every food has a distinct position on the Nutritional Target Map™, and specific areas of the Map align with common nutritional goals such as weight loss, optimum nutrition, and healthy weight gain
 |
 Caloric Ratio Pyramid™This graphic indicates the percentage of the food's calories that are derived from the three main macronutrients—carbohydrates, fats, and protein. If the food contains alcohol, a fourth number will appear that indicates the percentage of calories derived from alcohol. Each position within this special graph indicates a different caloric ratio. The top point of this pyramid indicates a food with 100% of its calories derived from fats (and 0% from carbohydrates and protein). As you move downward on the pyramid, the percentage of calories from fats decreases; the very bottom line of the pyramid indicates a food that is completely fat-free. In a similar manner, the left-most corner of the pyramid is 100% carbohydrate and the right-most is 100% protein. How to use the Caloric Ratio Pyramid™ Although there are differences of opinion over which ratios are most optimal for health and weight loss, many popular diets are based on a particular caloric ratio. For example, the USDA guidelines recommend that approximately 60% of the calories you consume should come from carbohydrates and approximately 30% from fat. Proponents of the Zone™ diet recommend a ratio (40%-30%-30%) much lower in carbohydrates but higher in protein. Advocates of the Atkins™ and South Beach™ diets recommend even lower consumption of carbohydrates, while many other diet philosophies focus on an ultralow consumption of fats. Regardless of which diet philosophy you subscribe to, the Caloric Ratio Pyramid™ will show you how various foods and meal plans align with your dietary goals. Any recommended caloric ratio can be envisioned as a "target zone." (Please see examples below.)  |
 Nutrition Data's OpinionNutrition Data awards foods 0 to 5 stars in each of three categories, based on their nutrient density (ND Rating) and their satiating effect (Fullness Factor™). Foods that are both nutritious and filling are considered better choices for weight loss. Foods that are nutritious without being filling are considered better choices for healthy weight gain. Foods that have more essential nutrients per calorie are considered better choices for optimum health. Note: Lower ratings do not necessarily mean that the food should be avoided but that it might be best consumed in moderation. Likewise, high ratings do not guarantee a perfect food but indicate a food that is more likely to be a positive addition to your diet. Nutrition Data also indicates whether a food is high or low in various nutrients, according to the dietary recommendations of the FDA.
Because of the health risks associated with overconsumption of saturated fat, cholesterol, and sodium, high levels of these nutrients are reported as "Bad," while high levels of more essential nutrients are reported as "Good." Nutrition Data also reports if more than 20% of the calories in the food come from sugars or alcohol, and if the food contains any trans fat. Nutrition Data's Opinion and ratings are editorial opinions of Nutrition Data, given without warranty, and are not intended to replace the advice of a nutritionist or health-care professional. No food is completely good or bad for you: Optimum nutrition depends on your individualized needs and the combined nutritional benefits of all foods that you consume. |
 Estimated Glycemic Load™Nutrition Data estimates the Glycemic Load of foods and recipes using a proprietary eGL formula. Because Glycemic Load is dependent on serving size, the eGL value will change if you adjust the serving size in the Serving Size drop-down at the top of the Nutrition Facts page. Glycemic Load gives an indication of how much a serving of a food is likely to increase your blood-sugar levels. A composite eGL is also generated as part of Nutrition Data's My Tracking report. This composite eGL is the sum of eGLs for all foods in your running total. To learn how to use My Tracking to analyze your diet, see the My Tracking Help page. How to use the estimated Glycemic Load™ Because Glycemic Load is related to the food's effect on blood sugar, low Glycemic Load diets are often recommended for diabetic control and weight loss. Foods with an eGL of 10 or less per serving are generally considered to have a low glycemic load. Foods with an eGL of 20 or more per serving are considered to have a high glycemic load. It is not necessary to avoid all foods with a high eGL to have a low glycemic diet, although you may wish to limit your intake of these foods. Experts vary on their recommendations for what your total for the day should be, but a typical target for total eGL is 100 or less per day, distributed somewhat evenly across your meals and snacks. If you have diabetes or metabolic syndrome, you might want to aim a little lower. If you are not overweight and are physically active, a little higher is acceptable. |
 IF (Inflammation Factor) Rating™Nutrition Data estimates the inflammatory or anti-inflammatory potential of individual or combinations of foods using a proprietary formula developed by Monica Reinagel. Foods with positive IF Ratings™ are considered anti-inflammatory and those with negative IF Ratings™ inflammatory. Because it is dependent on serving size, the IF Rating™ will change if you change the serving size in the Serving Size drop-down at the top of the Nutrition Facts page. If there is not enough data to calculate an IF Rating™, it will be indicated as N/A (not available). A composite IF Rating™ is also generated as part of Nutrition Data's My Tracking report. To learn how to use My Tracking to analyze your diet, see the My Tracking Help page. How to use the IF Rating™ Because systemic inflammation has been tied to an increased risk of a variety of diseases, many nutritional experts recommend an anti-inflammatory diet. It is not necessary to avoid all foods with negative IF Ratings™ to follow an anti-inflammatory diet, although strongly inflammatory foods should be eaten in limited quantities. The goal is to balance negative foods with positive foods so that the combined rating for all foods eaten in a single day is positive. A typical target for a single day is a combined IF Rating™ of 50 or higher. Those with inflammatory conditions or at increased risk for diseases linked with inflammation may try to reach a combined total of 200 or higher. |
 Nutrient Balance Indicator™Very few foods contain a complete array of essential nutrients; therefore, it's important to eat a variety of foods to fulfill our nutritional needs. The Nutrient Balance Indicator™ lets you see at a glance the nutritional strengths and weaknesses of a food, and can help you construct meals that are more nutritionally balanced. Each spoke in the wheel represents a different nutrient. The spoke for dietary fiber is colored green, protein is blue, vitamins are purple, minerals are white, and yellow represents a group of commonly overconsumed nutrients—saturated fat, cholesterol, and sodium. The density of each nutrient is indicated by how far that spoke extends towards the edge of the graph. A Completeness Score™ between 0 and 100 summarizes how complete the food is with respect to 23 essential nutrients. How to Use the Nutrient Balance Indicator™ The main purpose of the Nutrient Balance Indicator™ is to visually summarize a food's nutritional strengths and weaknesses. For example, in the above graphic, you can see that this food is a poor source of vitamin D, vitamin B12, and selenium but that the food does contain abundant amounts of dietary fiber, vitamin K, thiamin, vitamin B6, folate, manganese, and potassium. It is also high in sodium. This information can help you choose other foods that complement the strengths and weaknesses of this food and create a nutritionally complete diet. |
 Protein QualityProtein Quality is dependent on having all the essential amino acids in the proper proportions. If one or more amino acids are not present in sufficient amounts, the protein in a food is considered incomplete. Diets that are very low in protein or that are very restrictive in the types of protein consumed (e.g., vegetarian diets) may not provide complete protein. Each spoke on the Protein Quality Indicator™ represents one of the nine essential amino acids. The size of each spoke is proportionate to the percentage of the optimal level for that amino acid. The amino acid with the lowest level is considered the "limiting" amino acid for that food and determines the overall Amino Acid Score. How to Use the Protein Quality Indicator™ If the Amino Acid Score is less than 100, a link is provided to "complementary" sources of protein. These are foods that are higher in the limiting amino acid(s) and/or lower in the amino acids most prevalent in the food. By combining complementary proteins, you may be able to increase the overall quality of the protein you consume. Optimal levels for amino acids are based on the following amino acid profile recommended by the Institute of Medicine's Food and Nutrition Board:
Note: The Amino Acid Score calculated by Nutrition Data is a basic measure of protein quality, but it has not been adjusted for the digestibility of the protein. Protein digestibility depends on the type of protein (animal proteins are more digestible than plant proteins), as well as the method in which the food was prepared. If digestibility is accounted for, the Amino Acid Score will be somewhat lower than stated. |
NUTRITION INFORMATION
  |
    Nutritionists commonly classify dietary fat as either saturated, monounsaturated, or polyunsaturated, based on the number of double bonds that exist in the fat's molecular structure. For each of these three classes, there exists a large number of different chemical variations or "isomers". For reason of clarity, ND refers to each fatty acid isomer by it's numerical designation. The first number of this designation indicates how many carbon atoms are in the fatty acid molecule, and the number after the colon indicates the number of double bonds. Omega-3 and omega-6 isomers include "n-3" and "n-6" markings, and the letters c and t are used to indicate whether the double bonds are in cis or trans configurations. Many fatty acids also have systematic (non-numerical) names, as well as common names, which leads to some confusion in identifying them. To help make it easier to understand, we've prepared the table below, which puts all of the equivalent names together in one place.
| |||||||||||||||||||||||||||||||||||||||||||||||||||||||||||||||||||||||||||||||||||||||||||||||||||||||||||||||||||||||||||||||||||||||||||||||||||||||||||||||||||||||||||||||||||
  |
  |
 |
 |
 |
| Footnotes for Fish, eel, mixed species, raw Source: Nutrient data for this listing was provided by USDA SR-21. Each "~" indicates a missing or incomplete value. Percent Daily Values (%DV) are for adults or children aged 4 or older, and are based on a 2,000 calorie reference diet. Your daily values may be higher or lower based on your individual needs. Nutrition Data's Opinion, Completeness Score™, Fullness Factor™, Rating, Estimated Glycemic Load (eGL), and Better Choices Substitutions™ are editorial opinions of NutritionData.com, given without warranty, and are not intended to replace the advice of a nutritionist or health-care professional. Nutrition Data's opinions and ratings are based on weighted averages of the nutrient densities of those nutrients for which the FDA has established Daily Values, and do not consider other nutrients that may be important to your health or take into account your individual needs. Consequently, Nutrition Data's higher-rated foods may not necessarily be healthier for you than lower-rated ones. All foods, regardless of their rating, have the potential to play an important role in your diet. The Amino Acid Score has not been corrected for digestibility, which could reduce its value. IF Rating™ is a trademark of Monica Reinagel. Data for the IF Rating was provided by inflammationfactor.com. |
Tidak ada komentar:
Posting Komentar